Western Australia
Great Victoria Desert Study Areas
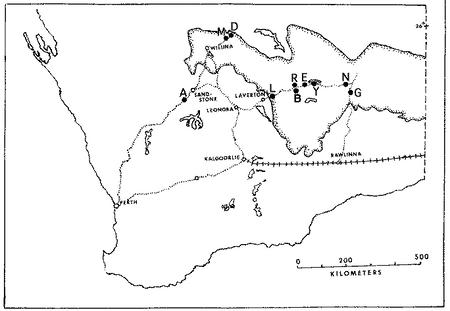
Positions of my 10 study sites in the Great Victoria Desert (stippled)
The Great Victoria Desert of Australia is also predominantly sandy with red sands, and supports a vegetation consisting mainly of so-called "spinifex" or "porcupine" grasses (genus Triodia) plus various species of gum trees (Eucalyptus). In wetter places and on harder soils, tracts of "mulga" (Acacia aneura) occur. Occasional dry lakebeds are inhabited largely by various shrubby chenopod species (including Atriplex lindleyi). Stabilized long red sandridges, parallel to prevailing winds and generally very much like those in the Kalahari, are scattered throughout the Great Victoria Desert, particularly in the eastern interior. Extensive areas of sandplain occur as well. The region is very heterogeneous and mixed habitats of shrubs, Triodia, Acacia, Grevillea, Hakea, and Eucalyptus occur on desert loams and sandy soils. Study sites A and M are on such ecotonal mixed areas.
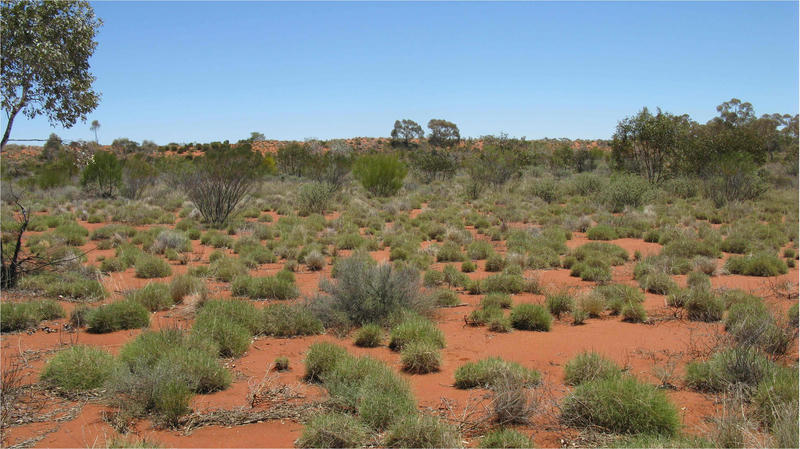
Red Sands study area. Sandplain with spinifex grass tussocks in foreground. Sandridge in background. 55 lizard species occur at this site (photo by S. E. Goodyear 2008).
"Red Sands" (area R) and area E are sandridge sites with marble gum trees (Eucalyptus gongylocarpa), a few desert bloodwood trees (Eucalyptus sp.), extensive spinifex (Triodia), and a variety of sandridge perennials (Acacia, Grevillea, and Hakea). On area D, a few scattered smaller sandridges and sand dunes support a lower and more open vegetation with fewer trees. Sandplain habitats also occur on these three study sites between sandridges. Two other areas, G and L, consist solely of such flat or gently rolling sandplains, with large marble gum eucalypt trees, spinifex and some scattered bushes. Areas B and N are "pure" spinifex flats (treeless grass desert), whereas area Y is a relatively pure (nearly treeless) shrub desert site in a dry lakebed. The last site was chosen because the structure of its vegetation was comparable to that of North American Great Basin Desert areas as well as that of Kalahari area G. Comparisons of numbers of lizard species present on these structurally similar chenopod shrub sites from 3 continental-desert lizard systems reveals 4-6 species in North America, 13 species in southern Africa, and 18 species in Australia.
Several expeditions were undertaken to the Western Australian deserts, the first in 1966-68 when eight areas were selected for study (see 66-67 Australian Censuses and Pianka 1969), and the second in 1978-79 when two sites were chosen for more intense analyses (one of these, area L, was also among the original eight and thus was examined on both trips. A new study site, the B-area, established in 1992 was the focus of a study on fire succession (below). I returned to three of these sites several more times during 1989-2008 (see below). Censuses of Australian lizards collected at each of these study sites were compiled (OZ Censuses).
Except for some type specimens lodged in the Western Australian Museum, all of the 1966-68 specimens are lodged in the Los Angeles County Museum of Natural History. Australian specimens collected since then are lodged in the Western Australian Museum (negotiations are currently underway with WAM to deposit a large synoptic collection in the Texas Memorial Natural History Museum here in Austin, Texas).
Species codes and family identities for Australian lizards are here:
Download csv file (Australian species codes).
I continued to monitor the Australian saurofaunas at the L-area and Redsands during 1989-1991 when I set up extensive pit trap lines. In 1992-94, dual funding from NSF and NASA allowed me to undertake a detailed satellite imagery remote sensing study of wildfires as agents of disturbance promoting habitat diversity in the Great Victoria desert of Western Australia (Haydon et al. 2000a, 2000b). An Australian field assistant ran pit trap samples for 3 months during the Austral Spring of 1992. A new study site, the B-area (Lat. 28° 13' 26.2"S, Long. 123° 35' 30.4"E), with pit trap lines was set up in 1992 and monitored before a controlled burn -- it was burned in October 1995 and monitored for 13 years following the fire during 1995, 1998, 2003 and 2008 to assess changes in community structure. B-area aerial photo showing locations of pit traps. Fire is increasingly recognized as a major contributor to species density and ecology, but what is the length of the recovery phase for desert lizard communities? My long-term census data provide insights into how individual species respond (species composition, relative abundance, dietary flexibility, and reproductive tactics). A total of 2846 individual lizards representing some 46 species were collected at the B-area from 1992 through 2008 (B-area Censuses).
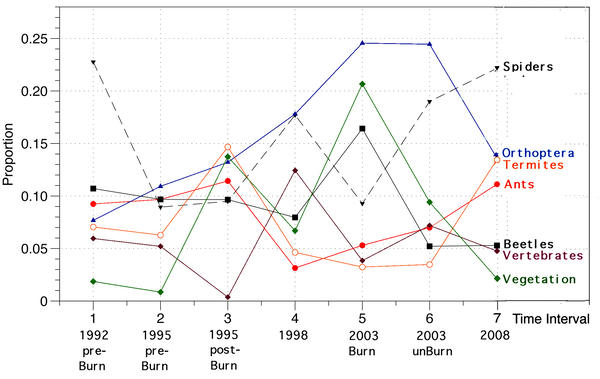
Stomach contents of these lizards reflect how arthropod prey resources changed during the fire succession cycle (Pianka and Goodyear 2012).
I began studies at Red Sands in 1978-79 (N = 1436) under a Guggenheim Fellowship, continued them during 1989-92 (N = 3196) with support from the National Geographic Society and as a Fulbright Senior Research Fellow, and made subsequent collections in 1995-96 (N = 2353), 1998 (N = 1272), 2003 (N = 895), and 2008 (N = 1075). Similarly, I conducted censuses on the L-area in 1966-68 (N = 532), 1978-79 (N = 1567), and 1989-92 (N = 1997). These data were used to study long-term changes (Pianka 1996) such as those that occur in response to fires and shrub encroachment due to increased precipitation (global weather modification). Lizard abundance and species richness both decreased from 1998 to 2008 as evidenced by sampling the exact same pits during the same months 3 times in ten years ranging from September-December 1998 to September-December 2003 and once again during September-December 2008.
Australian Data
For every lizard collected, the following information was collated in field notebooks (Link to pdfs of Field Notes): unique ID number, genus, species, sex (if possible), date, time of collection, active body temperature in oC, ambient air temperature at chest height in °C, where the lizard was when first sighted, and where it ran to, fresh field measured snout-vent length, fresh tail length and condition, and weight in grams. These data files can be downloaded here:
On sandridge sites, positions where each lizard was found were recorded (flat, base, slope, or crest). For many thousands of lizards collected from 1992 through 2008, pit trap numbers were also recorded. High resolution color aerial photos show precise locations of pit traps on three study sites (B, L, and R -- download here).
As in North America and the Kalahari, Australian lizards were dissected and sex and reproductive condition ascertained. Stomachs were removed and stomach contents identified into the same basic list of 20 different prey categories, most insect orders, only 19 of which occurred in Australia (solpugids are present in North America and the Kalahari, but absent in Australia). All snakes were collected and bird lists were assembled for both the Kalahari and Australian study sites (Pianka and Pianka 1970).
In 1978-79, a Guggenheim Fellowship allowed me to focus attention on two study areas: the L-area (N = 1567 lizards) and Redsands (N = 1436 lizards), to better characterize resource utilization by rare species. I hired a competent entomologist Dr. Thomas D. Schultz to go through stomach contents of these lizards identifying prey to the finest resolution possible. Ants and termites were placed into size and/or color categories by family to generate some 97 ant and 58 different termite resource states. Over 200 different prey categories were recognized, not all of which were present at either site alone. These data have been digitized but need to be linked to other files, cross checked against original data sheets, and imported into mySQL tables.
Global Climate Change
The Australian Bureau of Meteorology reports that long-term average annual precipitation in the region of the Great Victoria Desert is less than 200 mm (map shown below).
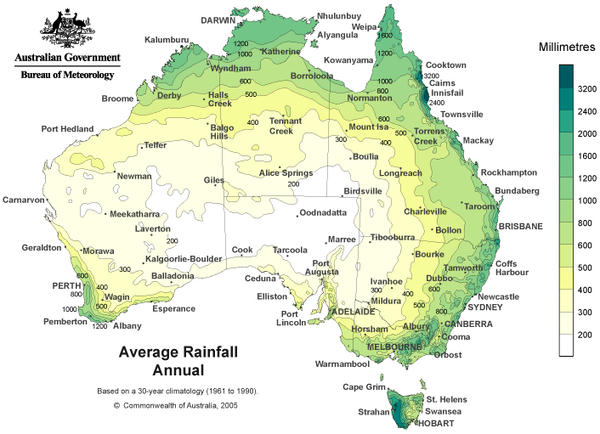
Moreover, whereas average annual rainfall over the past decade has fallen in eastern Australia and coastal areas, precipitation has increased in the interior of Western Australia. During the last 40 years, rainfall in this part of the GVD has increased by 20-30mm per decade above the long-term average (Australian Bureau of Meteorology map of deviations in precipitation from 1970 to the present). This striking change in rainfall regime is indicative of global climate change.
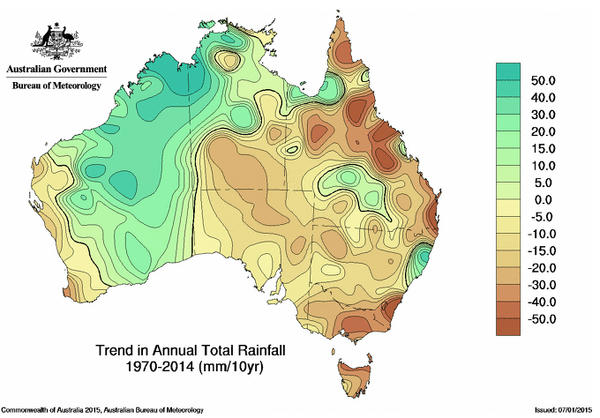
2014 Trend Map
In 2003, I was stunned that I did not recognize my long-term study areas and actually drove right past them because shrubs had increased so greatly in abundance! Spinifex, a vital microhabitat for many lizard species, has diminished with the increased abundance of shrubs. As a result of this increased rainfall, shrub encroachment seems to have changed these ecosystems profoundly. The changing vegetation appears to have affected both avian and lizard populations, and most likely has also impacted arthropod populations upon which birds and lizards depend for food. Old photographs of study sites will be compared with recent ones to document these changes in the vegetation. Changes in the relative abundances of lizard species and in their diets over this decade will constitute further evidence of global climate change as well as reveal its impact on insect and lizard faunas.
Because lizards are sedentary terrestrial ectotherms, they are very sensitive to temperature -- they respond rapidly to climatic change and can be used to monitor global warming. A recent study suggests that behavioral thermoregulation may enable ectotherms to adapt to global warming by shifting their seasonal patterns of activity and reproduction (Kearney et al. 2009; Huey and Tewksbury 2009). My extensive data on day and time of activity, microhabitat, ambient air temperatures and active body temperatures for thousands of desert lizards (82 species) will allow tests of the assumptions and predictions of their energy-mass balance models. In addition, my long-term (1966-2008) data on reproduction in Australian desert lizards will allow me to detect any such temporal shifts in reproductive cycles over a 42-year time interval.
Climate change appears to have altered the fire regime in the GVD as well: during the last two decades, fires have been more frequent and much more extensive than they were during the 1970's to the 1990's (Haydon et al. 2000a, 2000b). This new fire regime may result in a more homogeneous landscape, which could reduce habitat heterogeneity and species diversity, and might even lead to local extinctions.
References
-
Pianka, E.R. 1969. Habitat specificity, speciation, and species density in Australian desert lizards. Ecology 50: 498-502. Download pdf.
-
Pianka, E. R. 1973. The structure of lizard communities. Annual Review of Ecology and Systematics 4: 53-74. Selected as "This Week's Citation Classic" in Current Contents (Agriculture, Biology & Environmental Sciences) (1988), volume 19 (number 35): page 18. Download pdf.
-
Pianka, E. R. 1974. Niche overlap and diffuse competition. Proc. Nat. Acad Sci. 71: 2141-2145. Download pdf.
-
Pianka, E. R. 1975. Niche relations of desert lizards. Chapter 12 (pp. 292-314) in M. Cody and J. Diamond (eds.) Ecology and Evolution of Communities. Harvard University Press.
-
Pianka, E. R. 1986. Ecology and Natural History of Desert Lizards. Analyses of the Ecological Niche and Community Structure. Princeton University Press, Princeton, New Jersey.
-
Pianka, E. R. 1996. Long-term changes in Lizard Assemblages in the Great Victoria Desert: Dynamic Habitat Mosaics in Response to Wildfires. Chapter 8 (pp. 191-215) in M. L. Cody and J. A. Smallwood (eds.) Long-term studies of vertebrate communities. Academic Press. Download pdf.
-
Pianka, E. R. and S. E. Goodyear. 2012. Lizard responses to wildfire in arid interior Australia: Long-term experimental data and commonalities with other studies. Austral Ecology 37: 1-11. Download pdf.
-
Pianka, E. R. and R. B. Huey. 1971. Bird species density in the Kalahari and the Australian deserts. Koedoe 14: 123-130. Download pdf.
-
Pianka, H. D. and E. R. Pianka. 1970. Bird censuses from desert localities in Western Australia. Emu 70: 17-22. Download pdf.