Methods

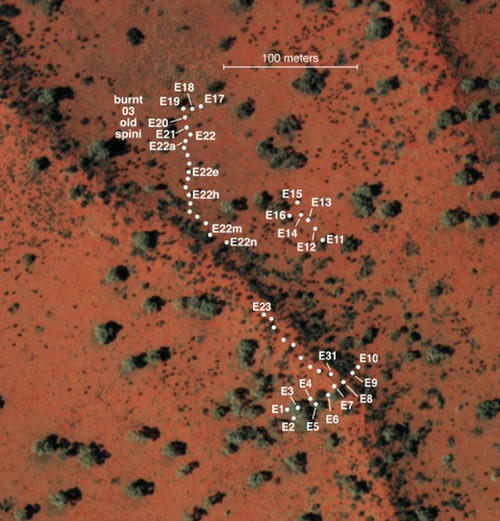
The East pit trap line at Redsands, showing locations of pits. A sandridge runs diagonally across the scene. Large green areas are Marble gum trees. Thousands of individual lizards and dozens of species have been collected from these pits over the past two decades. I have similar data for 3 other pit trap lines at this study site. Resolution of aerial photos is higher than depicted here.
To gather data on ecological relationships of these lizard faunas, my assistants and I walked transects of many thousands of kilometers through study sites observing lizards. Between 1962 and 1979 we spent five full years in the field and nearly twelve man-years collecting data on lizards (sites were visited repeatedly over essentially the full seasonal period of lizard activity). Microhabitat and time of activity were recorded for most lizards encountered active above ground.
Early on (1962-68, 1970, 1978-79), lizards were hunted and captured during their normal daily course of activity, providing data on time of activity, microhabitat, ambient air temperature, and active body temperature. These data suffered, however, from collector bias and did not provide reliable estimates of relative abundance.
I changed my research protocol in 1989, since then most lizards have been pit trapped. Although trappability varies from species to species, this technique provides a standardized collecting method that allows relative abundances to be compared across space and time. It also allows informative estimates of point diversity, which can be used to infer habitat requirements.
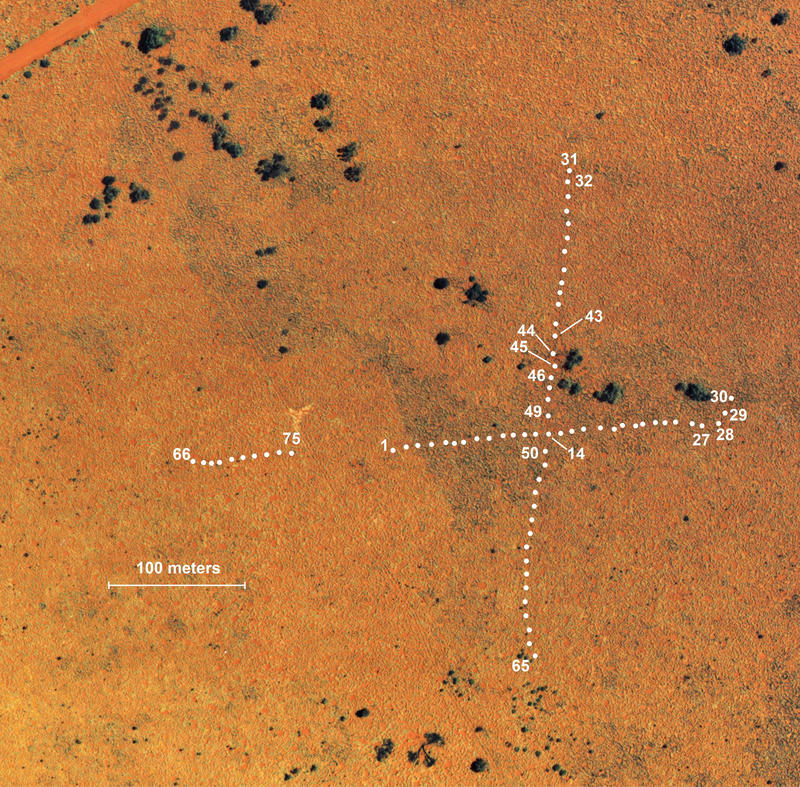
During two decades from 1989 through 2008, I made six expeditions down under (in 1989-91, 1992, 1995-96, 1998, 2003, and 2008) concentrating my efforts on several Australian study sites and began extensive pit trapping (over 62,000 trap days, and 12,634 specimens) in the Great Victoria Desert. Pit traps were located precisely on high-resolution aerial photos (part of one shown above) of study areas for a GIS analysis of habitat and microhabitat requirements. A census was taken in 1992 on a long unburned site to obtain pre-burn data, which was burned in 1995, with subsequent post-burn censuses in 1995, 1998, 2003, and 2008.
Data Protocols
Stomach contents of these lizards were exploited to evaluate how arthropod prey resources change during the course of the fire succession cycle. Snakes, birds, and mammals observed on study areas were recorded, and, in some cases, collected. Whenever possible, lizards were collected so that their stomach contents and reproductive condition could be assessed later in my laboratory. Resulting collections of some 3,974 North American specimens, 5,378 Kalahari animals, plus 20,599 Australian ones, representing nearly 100 species in 16 of the currently recognized 38 extant families of lizards, are lodged in the Los Angeles County Museum of Natural History, the Museum of Vertebrate Zoology of the University of California at Berkeley, the Western Australian Museum, and the Texas Memorial Museum.

Aerial photo of this study site (the B-area) showing locations of 75 pit traps.
In all three continental desert-lizard systems, the same 15 basic microhabitats were recognized: subterranean (for unknown, presumably largely historical, reasons, no subterranean lizards exist in North American deserts), open sun, open shade, grass sun, grass shade, bush sun, bush shade, tree sun, tree shade, other sun, other shade, low sun (within 30 cm. above ground), low shade, high sun and high shade (over 30 cm. above ground). For some purposes, finer microhabitat resource categories were used. Lizards at an interface between two or more microhabitats were assigned fractional representation in each. Only undisturbed lizards were used in these analyses. Considerable fidelity in microhabitat utilization is evident. Many species separate out using just these 15 very crude microhabitat categories: for example, some species frequent open spaces between plants to the virtual exclusion of other microhabitats, whereas other species stay much closer to cover. Microhabitat data summaries are given in the Data.
For analyses of stomach contents, the same 20 basic prey categories were distinguished on all continents: centipedes, spiders, scorpions, solpugids, ants, wasps, locustids, blattids, mantids and phasmids, neuroptera, coloptera, isoptera, heimiptera and homoptera, diptera, lepidoptera, insect eggs, insect larvae, miscellaneous unidentified insects, vertebrates (including shed skin and reptile eggs), and plant material (both floral and vegetative).
Prey items were counted and their volumes estimated. As is true of microhabitat utilization, considerable consistency in diets are evident among species. For example, some species eat virtually nothing but termites, whereas others never touch them. Moreover, diets of many species change little in space or time. For some purposes, much finer prey categories could be used. Termites were identified to species and caste for Kalahari lizards. Similarly, I was fortunate to get a competent entomologist Tom Schultz to identify prey to the finest possible categories for the 1978-79 Australian data set resulting in over 200 prey categories.
A major virtue of these data is that identical methods and resource categories were used by the same investigator for each of three continental desert-lizard systems, enabling meaningful intercontinental comparisons. This unique body of data has thus allowed detailed analyses of resource utilization patterns and community structure in these historically independent lizard faunas (Pianka 1974, 1975, 1986).
Moreover, both dietary and microhabitat niche breadths and overlaps can be estimated as well as species diversities and the spectra of resources actually exploited by entire lizard faunas varying widely in number of species. Another dimension that can often be profitably interpreted is variation in species utilization patterns (niche shifts) through time and between areas. Still another analysis that should be performed is to look for long-term changes in reproductive cycles in response to climate change. To date, I have done relatively little with ontogenetic changes, variation, or sexual dimorphisms but these data can and should be examined from those perspectives.
In any undertaking of this magnitude, errors inevitably arise. These range from transposed numbers to misplaced decimals to other typographic errors. Quality control is necessary to assure data accuracy. Data that cannot be verified will have to be discarded.
Anatomical Data

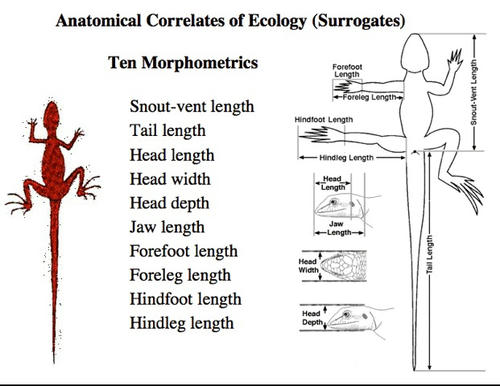
Fresh snout-vent length (SVL), tail lengths, and weights were measured for all lizards in the field before preservation. Regressions of whole unbroken tail lengths on SVL allowed estimation of tail lengths for lizards with broken or regenerated tails. Nine morphological measurements were made on a subset of preserved specimens of each species: snout-vent length, head length, head width, head depth, jaw length, foreleg length, hindleg length, forefoot length, and hindfoot length. Preserved tail length can be estimated from fresh tail lengths.
Some of these morphological measurements have been digitized and have been collated with other files to associate sex with anatomy. Many more morphological measurements remain to be digitized and most specimens collected since 1995 have not yet been measured. These data will be checked for accuracy by plotting each morphometric against SVL and looking for outliers. This will be a time consuming and tedious task, requiring assistants. For a preliminary analysis, see Towards a Periodic Table of Lizard Niches (Power Point Presentation, View in Safari).